The ROI Reckoning: A Line-by-Line Breakdown of What Cabin Power Retrofits Actually Return
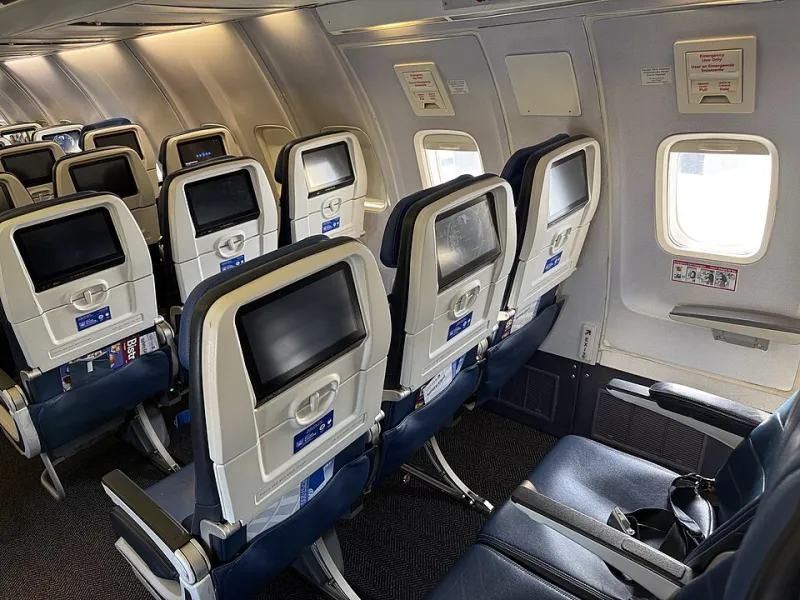
Photo: 4300streetcar, CC BY 4.0, via Wikimedia Commons
Capital allocation decisions in commercial aviation are rarely simple, but cabin power retrofit projects have developed a particular reputation for financial ambiguity. Ask a fleet planning team to model the return on a cabin charging modernization program and you are likely to receive a cost estimate with reasonable precision alongside a revenue projection that is either incomplete, overly conservative, or built on assumptions that haven't been updated since the last fleet cycle.
The consequence is systematic underinvestment. Airlines that model retrofit ROI poorly tend to defer projects longer than the economics justify, accumulate avoidable maintenance liabilities, and cede passenger satisfaction ground to carriers who ran the numbers more completely. What follows is a framework for doing it right — a line-by-line reconstruction of what cabin power modernization actually costs and what it genuinely returns.
Line 1: Installation Cost — The Number Everyone Gets Right (Mostly)
The capital expenditure side of the retrofit ledger is, in relative terms, the easier half of the equation. Hard costs — seat-level hardware, wiring harness modifications, power distribution unit replacements, STC fees, and labor — are reasonably well understood by most procurement teams.
What gets missed: downtime cost is frequently underestimated. Aircraft out of service for cabin modification represent revenue-generating capacity that is temporarily offline. A single narrow-body aircraft generating $15,000 to $25,000 in daily revenue contribution means that a four-day retrofit window carries a real opportunity cost that should be included in the total installed cost figure, not treated as a scheduling footnote.
Corrective action: Build downtime cost into the capital expenditure line at the project planning stage, not as an afterthought. It changes the urgency calculus around scheduling efficiency.
Line 2: Maintenance Savings — The Return That Compounds Quietly
This is where most ROI models leave the most money on the table. Aging USB-A charging infrastructure, undersized power distribution units, and first-generation seat electronics generate maintenance events at rates that are well-documented in MRO records but rarely translated into forward-looking financial projections.
Contemporary cabin power systems — featuring solid-state power controllers, integrated fault isolation, and modular seat electronics units — demonstrate materially lower unscheduled maintenance rates than the legacy hardware they replace. Industry data from MRO providers suggests that next-generation charging infrastructure can reduce cabin electrical maintenance events by 30 to 50 percent over a five-year horizon.
For a 150-seat narrow-body operating 3,000 cycles per year, even a modest reduction in cabin write-ups translates to tens of thousands of dollars in avoided labor and parts costs annually. Across a fleet of 50 aircraft, the maintenance savings line alone can justify a meaningful portion of the retrofit investment.
Corrective action: Pull five years of cabin electrical MEL deferrals and maintenance write-up data before building the ROI model. The savings projection should be grounded in your fleet's actual failure history, not industry averages.
Line 3: Ancillary Revenue Uplift — The Line That Requires Honest Accounting
The connection between in-seat power reliability and ancillary revenue generation is well-established in passenger behavior research. Travelers who successfully charge devices during flight demonstrate higher rates of in-flight purchase activity across entertainment, food and beverage, and connectivity services. The mechanism is straightforward: a passenger with a functional device is a passenger with a viable payment method and an active engagement channel.
US carriers that have completed cabin power modernization programs and tracked post-installation ancillary performance report uplift figures ranging from $1.50 to $4.00 per passenger per flight, depending on route profile and cabin configuration. Applied across annual seat capacity, these figures are not marginal.
The honest accounting challenge: ancillary revenue uplift is difficult to isolate from other variables. Carriers that upgraded power infrastructure simultaneously with entertainment or connectivity improvements cannot cleanly attribute revenue changes to power alone. This attribution difficulty leads finance teams to discount or exclude the line entirely — which is the wrong response to measurement uncertainty.
Corrective action: Use a conservative attribution fraction — apply 30 to 40 percent of measured ancillary uplift to the power upgrade specifically — rather than excluding the line. An imprecise positive number is more accurate than zero.
Line 4: Crew Efficiency — The Hidden Labor Dividend
Flight attendant time spent responding to passenger complaints about non-functional charging ports is not typically captured in cabin power ROI models. It should be. Crew labor is expensive, and complaint-driven interactions represent unproductive time that could otherwise be directed toward service delivery or safety tasks.
Airlines with high rates of cabin power failures report that charging-related passenger inquiries represent a disproportionate share of in-flight service interruptions on certain aircraft types. While precise measurement requires structured cabin crew feedback programs — which most airlines do not currently operate — conservative estimates suggest that eliminating the majority of power-related complaints on a single aircraft type can recover 15 to 30 minutes of productive crew time per flight.
At scale, across a large narrow-body fleet, this represents a material labor efficiency gain — one that also has a secondary effect on crew satisfaction and, by extension, retention metrics.
Corrective action: Survey flight attendants on complaint frequency before and after retrofit programs. Even rough data points allow for a credible crew efficiency line in the model.
Line 5: Passenger Retention and Loyalty Value — The Long-Duration Return
This is the line that airline finance teams are most likely to exclude because it is the hardest to quantify with precision. It is also, over a five-to-seven-year horizon, potentially the largest single return in the model.
US airline loyalty economics are well-studied. The lifetime revenue value of a retained frequent flyer — particularly a business traveler — ranges from tens of thousands to hundreds of thousands of dollars, depending on travel frequency and fare class distribution. Passenger satisfaction research consistently identifies in-flight power and connectivity reliability as among the top drivers of carrier preference for business travelers.
A cabin that reliably delivers charging performance converts a functional amenity into a loyalty signal. A cabin that fails to do so — particularly for a business traveler whose livelihood depends on device availability — converts a functional failure into a defection risk.
Corrective action: Work with your revenue management and loyalty team to establish a conservative customer lifetime value figure for the business traveler segment. Apply a small churn-reduction percentage attributable to power reliability improvements. The resulting number will likely surprise the finance team.
Line 6: Competitive Positioning — The Cost of Not Investing
ROI models are typically structured to evaluate the returns from action. They should also account for the costs of inaction. In a US domestic market where the top four carriers compete aggressively on cabin experience, a carrier operating USB-A-only or chronically underpowered cabins is not holding a neutral position — it is actively conceding ground.
Route-level analysis of passenger preference data increasingly shows that travelers with flexibility make carrier selection decisions based on cabin amenity differentials. On competitive routes where schedule and price are comparable, cabin experience — including power availability — functions as a tiebreaker.
Corrective action: Include a competitive displacement cost in the model. Even a conservative estimate of revenue at risk from cabin experience inferiority changes the investment urgency calculation.
Building the Complete Model
A cabin power retrofit ROI model that incorporates all six lines — installation cost including downtime, maintenance savings, ancillary revenue uplift, crew efficiency, passenger retention value, and competitive positioning cost — will consistently produce a more compelling investment case than the truncated version most finance teams are currently running.
The goal is not to inflate projections. It is to ensure that the decision is made on the full financial picture rather than a partial one. In most cases, the complete model does not just justify the investment — it argues for accelerating it.